Using Application Insights For Better Application Logging
As you gain more experience as a developer, you soon realize the importance of good logging for your applications. When an app is small, you can get away with console logging, print statements, etc. But once your app reaches any real size or functionality, especially as you reach your MVP state, it’s time to have some real logging. For that, we can turn to Application Insights.
Application Insights is an Azure cloud-hosted logging platform that you can use to keep track of the performance and errors in your live web apps. As the Microsoft docs put it, you can use App Insights to “automatically detect performance anomalies, diagnose issues, see what users actually do with your apps, and help improve app performance and usability”.
When most people think of App Insights, they generally believe it’s just for ASP.NET web apps. Wrong. So very wrong. App Insights is available for all .NET applications, Node.js, Java, Python and JavaScript. It works for on-prem, hybrid and cloud apps. It can even be used for mobile apps on iOS and Android. App Insights is so much more than ASP.NET.
App Insights also works with a wide variety of logging frameworks, such as ILogger, NLog, System.Diagnostics, Log4J, Java, Log4Net, LogStash, and LogBack. So if you’re already using a favorite logging framework, hooking it into Application Insights is quick and easy. But my favorite use case is using it on my web app front ends to track issues.
App Insights on JavaScript
Anyone who creates web apps knows creating a working front end is hard. There are a lot of browsers on a lot of operating systems, and a lot of different versions of those browsers can exist. It can turn front-end development into a real nightmare at times with bugs that crop up only on certain browsers, versions, or operating systems.
App Insights can give you a clear look into your browser errors, making it easy to group error logs by various keys like OS or browser version. This helps you easily prioritize your bug fixes and make it easier to track down the cause of error messages. What’s more, it will help you identify bugs that your users have never even reported.
We all know end users aren’t the most reliable source of bug reporting. They get important details wrong and usually have no idea how to grab important information that you need, like console messages. “What’s an F12 key?” With Application Insights, those detailed messages get sent to your data store without any user interaction needed.
Installation
Installation for your JavaScript front end is quick and easy. Start by using npm to install the App Insights SDK:
npm i --save @microsoft/applicationinsights-web
Once the package is installed in your app, just add a piece of code to your main page.
import { ApplicationInsights } from '@microsoft/applicationinsights-web'

const appInsights = new ApplicationInsights({ config: {
  connectionString: '<<CONNECTIONSTRING TO APP INSIGHTS INSTANCE>>'
} });
appInsights.loadAppInsights();
You can add one additional piece of code to track details around the current user/session:
appInsights.trackPageView();
And that’s all you need to get started. There are a bunch of other configuration settings you can add to your “new” command to fine-tune the details you gather and how App Insights will work for your application. And you will definitely want to spend some time learning how to fine-tune the data that you send. You need to be careful about the data you’re collecting from your user’s instance, after all.
If you’re using a framework like Angular or React, there are additional plugins and some things you’ll want to be careful of so your data collection isn’t causing problems for you or your users. You can get more details on that in the official docs linked above.
App Insights Homepage & Dashboard
Once you’re collecting data from your application, you can start to analyze the results in the Azure Portal. The first place to start is the Overview on the homepage.

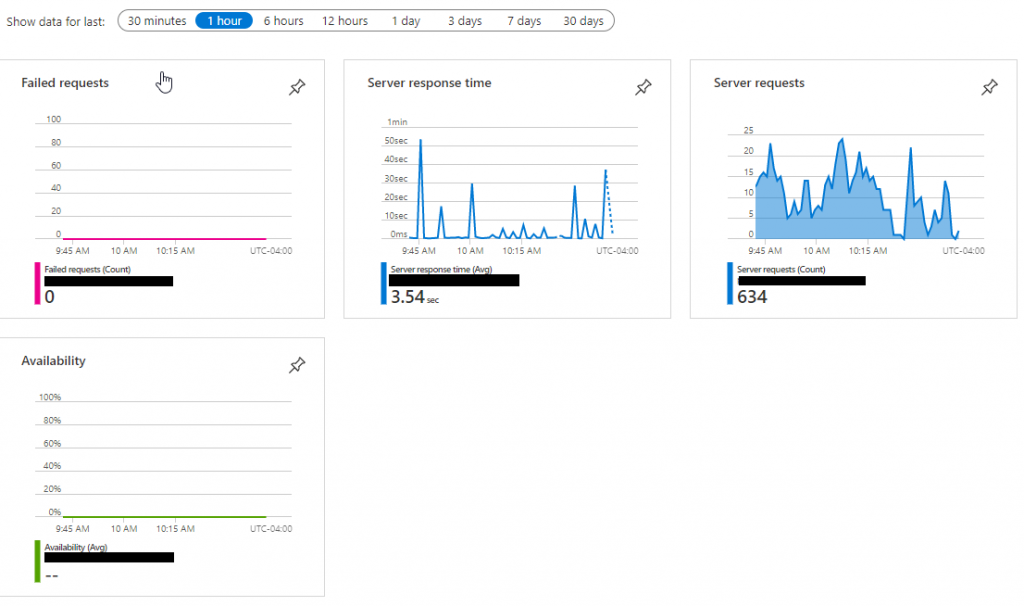
App Insights homepage view
The main homepage by default provides some graphs of performance data metrics that can be quickly viewed for the last 30 minutes, 1 hour, 6 hours, 12 hours, 1 day, 3 days, 7 days, or 30 days. The information available can vary based on your app and installation, but it can give you information on things like failed requests, response time, number of requests, and availability.
This information is great for quick spotting trends like times when your app is popular, how hard your servers are being hit, times when errors happen more often, and so forth.
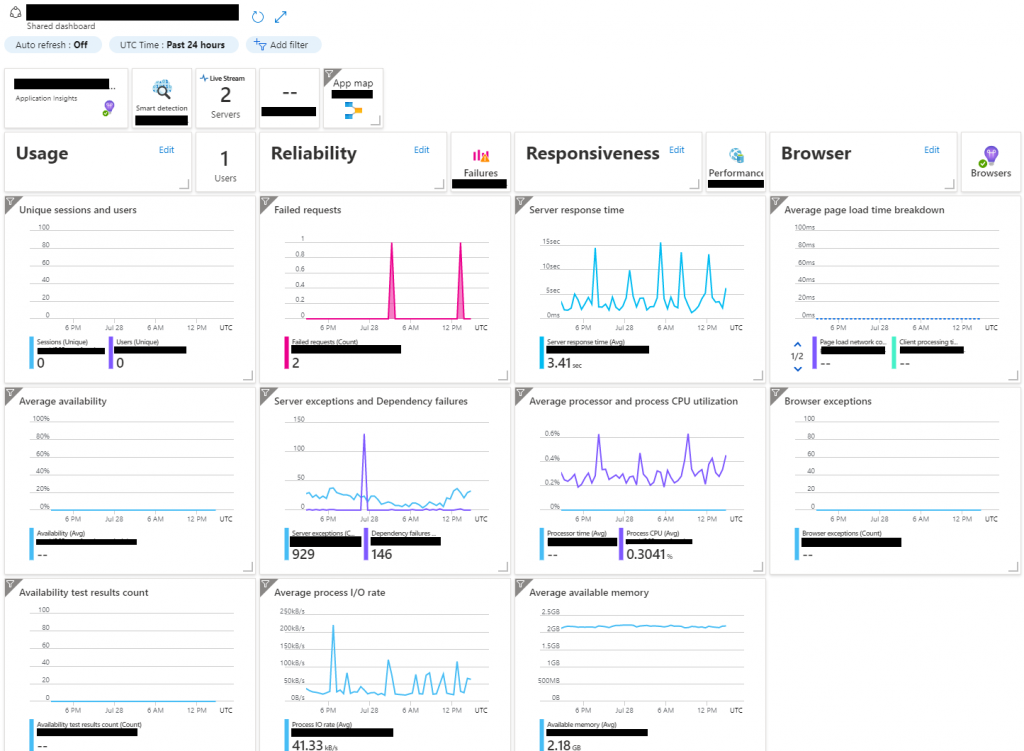
To view the main Application Dashboard, click the button at the top left of the page that says “Application Dashboard”. This view goes into more detail the homepage graphs on the current performance and statistics of your application.

Detailed Application Dashboard view
Querying the Logs
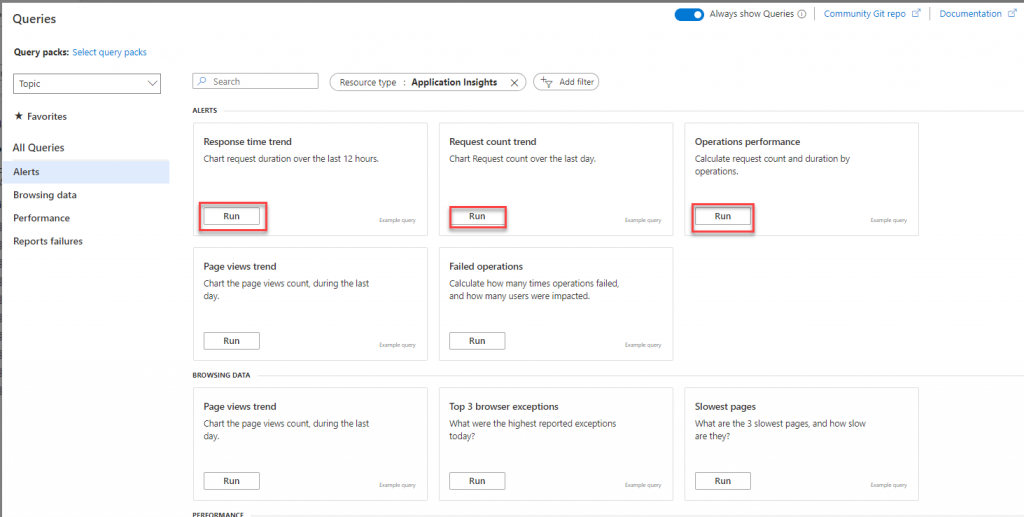
Graphs and statistics are great, but what if you want to delve into the details? Easily done. App Insights provides a query interface that allows you to run a number of pre-defined queries, or create your own query. To get access to the logs data, click the “Logs” button at the top of the screen.
By default, you will be shown a list of pre-defined queries that Application Insights has already defined for you. Each one has a “Run” button next to it and all you need do is click the button to run a default query with default parameters.

Default queries example page
To write your own query, just close out of the Queries dialog and you’ll be shown the query dialog where you can enter it. Application Insights uses the Kusto query language (also used by Azure Data Explorer). Those of you familiar with SQL will find a number of similarities and should find it rather easy to pick up once you get used to the quirks of structuring your query.
Take, for instance, the following out-of-the-box query:
requests
| where success == false
| summarize failedCount=sum(itemCount), impactedUsers=dcount(user_Id) by operation_Name
| order by failedCount desc
This query searches the “requests” data set (table) and filters that data based on the value of “success” being false. In that result set, it asks the system to return a summary of the data including a sum of “itemCount” and distinct “user_id” grouped by the “operation_Name” and to return those results in descending order by the failedCount value.
An equivalent SQL statement would look something like this:
SELECT SUM(itemCount) AS failedCount, DISTINCT(user_id) AS impactedUsers
FROM requests
GROUP BY operation_Name
ORDER BY failedCount DESC
As you can see, the structure is similar between KQL and SQL, but the order and semantics are a bit different. Either way, it’s fairly straightforward and should be fairly easy to pick up.
KQL makes it extremely easy to delve deeply into your logs and help identify the true issues at the heart of your application’s problems.
More To Application Insights
There’s a lot more to App Insights. What I’ve presented above barely scratches the surface. For instance, Application map can provide you insight into your application’s interactions with external systems and apps, including how many calls and the average call time being made to each.
Smart detection will provide some automated insights into the performance of your application and suggest some possible solutions to address the problems.
Live metrics allows you to watch telemetry in real-time so you can see what is happening in your app as it happens.
Transaction search helps you delve into various events and activities that App Insights has tracked within your application from end to end. For instance, you can see the details of a call to an HTTP endpoint.
Availability, Failures, and Performance provide a detailed analysis of your application’s overall health.
You can set alerts to notify you when certain thresholds are triggered. For instance, alert you if you see a sudden spike in 500 errors over the last 5 minutes.
And the Usage section allows you to delve into what your users are doing, how they move from page to page, the time they’re spending on various pages, and so forth to help you analyze problems in your application’s flow.
The Future
What does the future hold for Application Insights? That’s complicated. Classic App Insights has been replaced with what they call the workspace-based Application Insights. Classic App Insights is now deprecated and due to be retired in February 2024.
Workspace-based App Insights is the current version and any new instance should be created in this version. However, Microsoft is also embracing OpenTelemetry as the future of instrumentation. How much integration between App Insights and OpenTelemetry will occur is still somewhat an open question.
The back-end will pretty much remain the same. You’ll use the same interface to search and query the log data. The primary difference between App Insights and OpenTelemetry is how you implement their different SDKs in your application code.
So the main question is how long Microsoft will support two different sets of SDKs for collecting and ingesting the log data. But that’s not a question for today. OpenTelemetry is still being fleshed out as a standard and what SDKs are available so far for the various languages are still in preview. So any decisions are still years away. For now, the Application Insights SDKs are still the way to go.
I hope this brief introduction to Application Insights has you thinking about the possibilities. There is so much more to it than I’ve touched on here. And every application should have a robust log analysis tool connected to it. The days of generating log text files or logging to SQL tables are done. You need a tool like App Insights. So go forth and start analyzing those logs!

